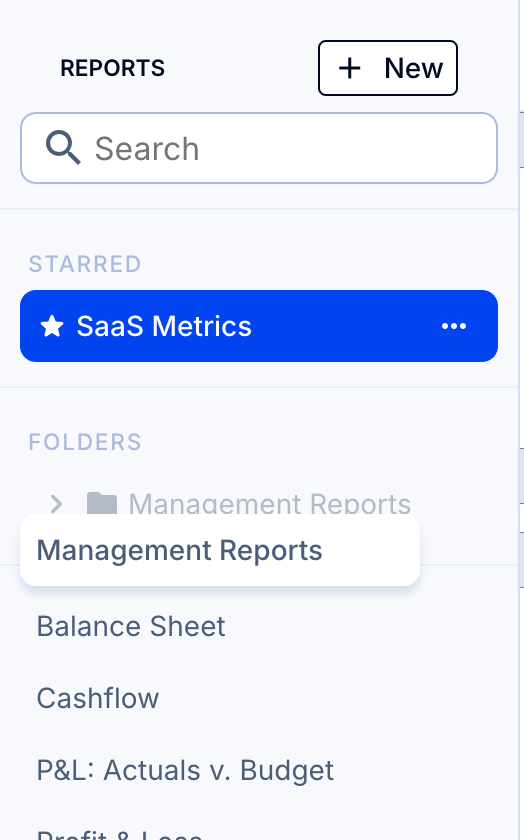
Reports are on the Reports tab, where you can view, format, edit and create reports and organize them into folders.
Before you start, configure your P&L and balance sheet in the Load Data tab - this is detailed in the two articles below.
- How to configure your P&L and balance sheet in ScaleXP (consolidated company)
- How to configure your P&L and balance sheet in ScaleXP (single company)
Find the reports section
- Click Reports in the top menu bar.

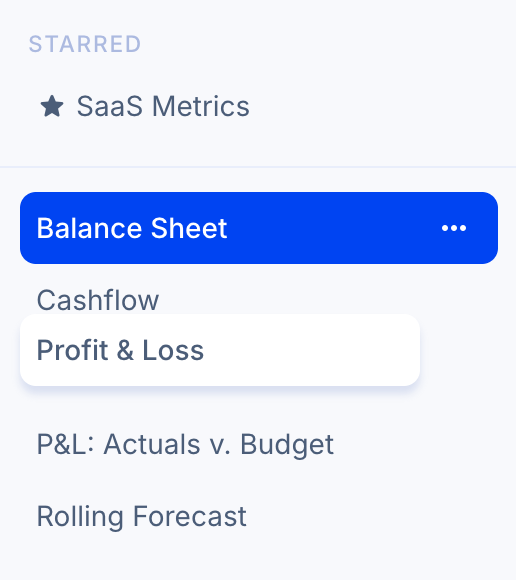
You can see the list of reports on the left sidebar. Some basic financial reports are pre-populated for you as a starting point; these are fully customizable.
- Select the report to view using the menu on the left sidebar; it will be highlighted in blue and the title will appear at the top left of the page.
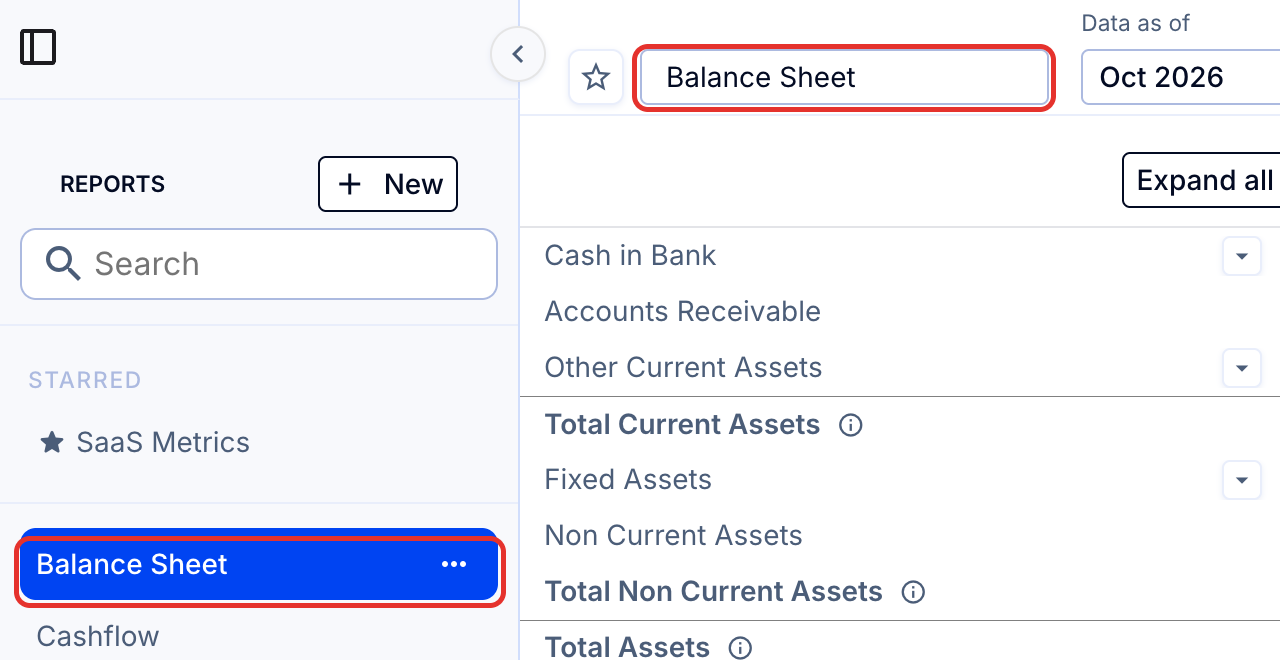
All reports can be downloaded to Excel or CSV (see How to download a report to Excel) and are instantly available for use in presentations. At the top of the page you will see the report name on the left. This title can be edited either here or in the sidebar view.
Pin reports (optional)
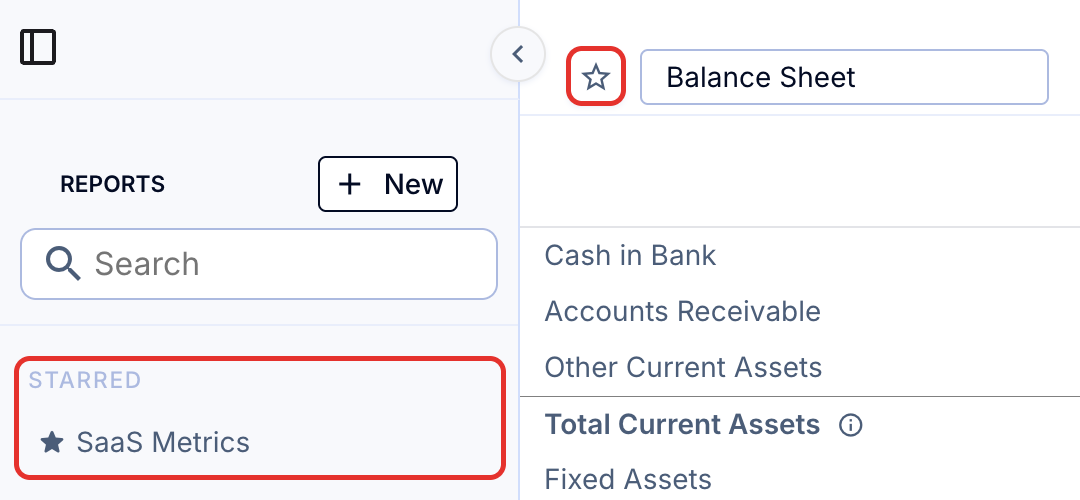
To the left of the title is a star. Use this to pin key reports for easy reference. Pinned reports appear at the top of the list, in the STARRED section.
Select dates and column configuration
Next to the title is the Data as of dropdown. This sets the month treated as "current" for the report's date ranges. The Columns dropdown lists the column layouts available, including various date ranges and views against budget. Where relevant, you can also add views by entity, department, and more.
Read more about column options, as well as fixed versus variable date ranges, in How to create and edit report columns.

See the transactions behind a figure
Any account row in a report can be opened to show the transactions behind it. Select the figure and ScaleXP lists every transaction in that column's period - date, source, reference, contact, description, debit, credit, and running balance - so you can check a number without leaving the report. Subtotals and calculated rows have no transaction list. See How to see transaction detail behind account balances.
To export every transaction behind a P&L report for a month, quarter, year to date, or full year, click the download icon (top right, next to Share) and choose Download Transaction Detail. See How to download a report to Excel.
Format an existing report
Use the Format button (top right) to format the whole report at once. Options include adding a % of revenue column, showing general ledger account numbers, showing values in thousands, setting decimal places, showing expenses as negatives, showing negatives in brackets, and changing the currency.
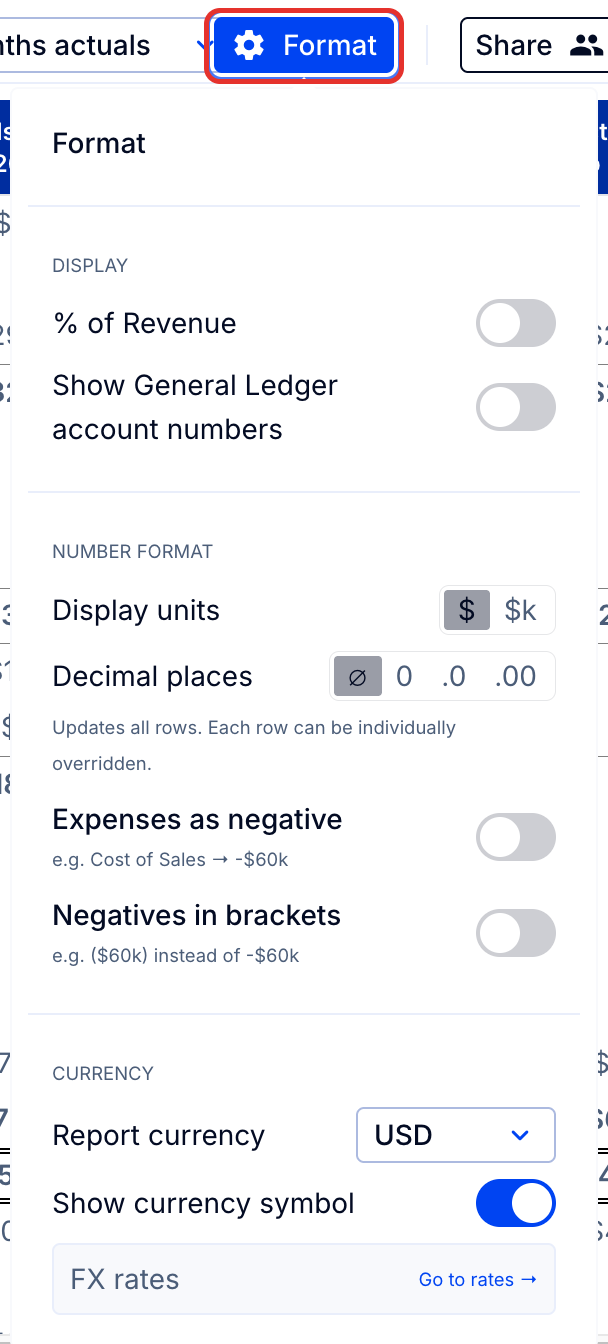
See How to format a report for detail on all of these options, and How to add a % revenue column for the new % of revenue toggle.
Edit an existing report
Click Edit (top right) to open the edit menu. From here you can Edit rows, Edit columns, open Configure base Profit & Loss or Balance Sheet (your chart of accounts and groupings), Edit budget, Duplicate the report, or Delete report.
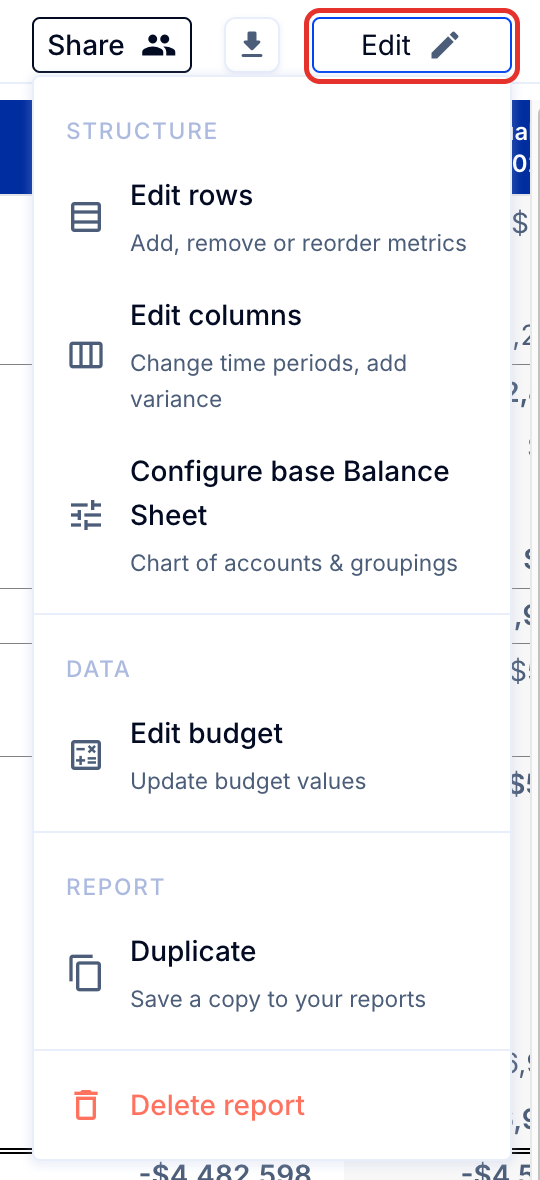
Read more in How to edit a report and create your own custom rows and columns.
Create a new report
- Click the + New button.
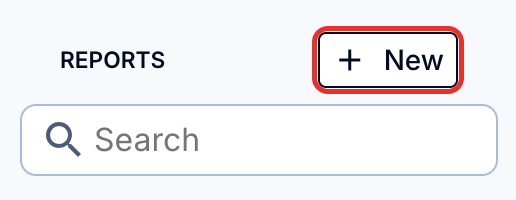
- Select New report.
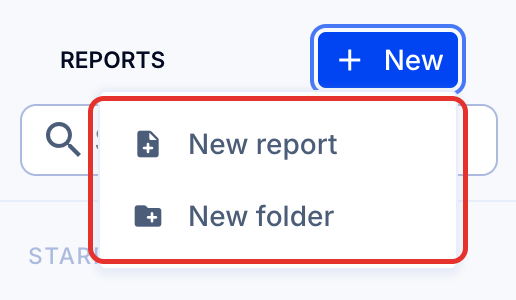
Read more about new report options in How to create a new report from a template.
Organize your reports: Create folders
- Click the + New button, then New folder.
- Move any unstarred report into the folder.
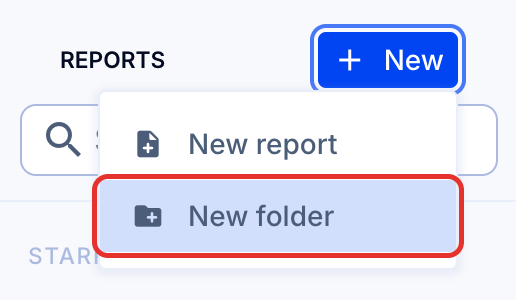
Read more in How to create folders for Reports.
Organize your reports: Reorder reports and folders
Reorder your reports by clicking on a report name and dragging it to a new position within the list on the sidebar.
Move within the starred section, within a folder, or within the list below the folders.
Similarly, reorder folders by clicking on a folder name and dragging it to a new position within the folders list.