Import up to two categories of Zoho reporting tags, then use them in your ScaleXP reports, dashboards and metrics.
1. Import your reporting tags
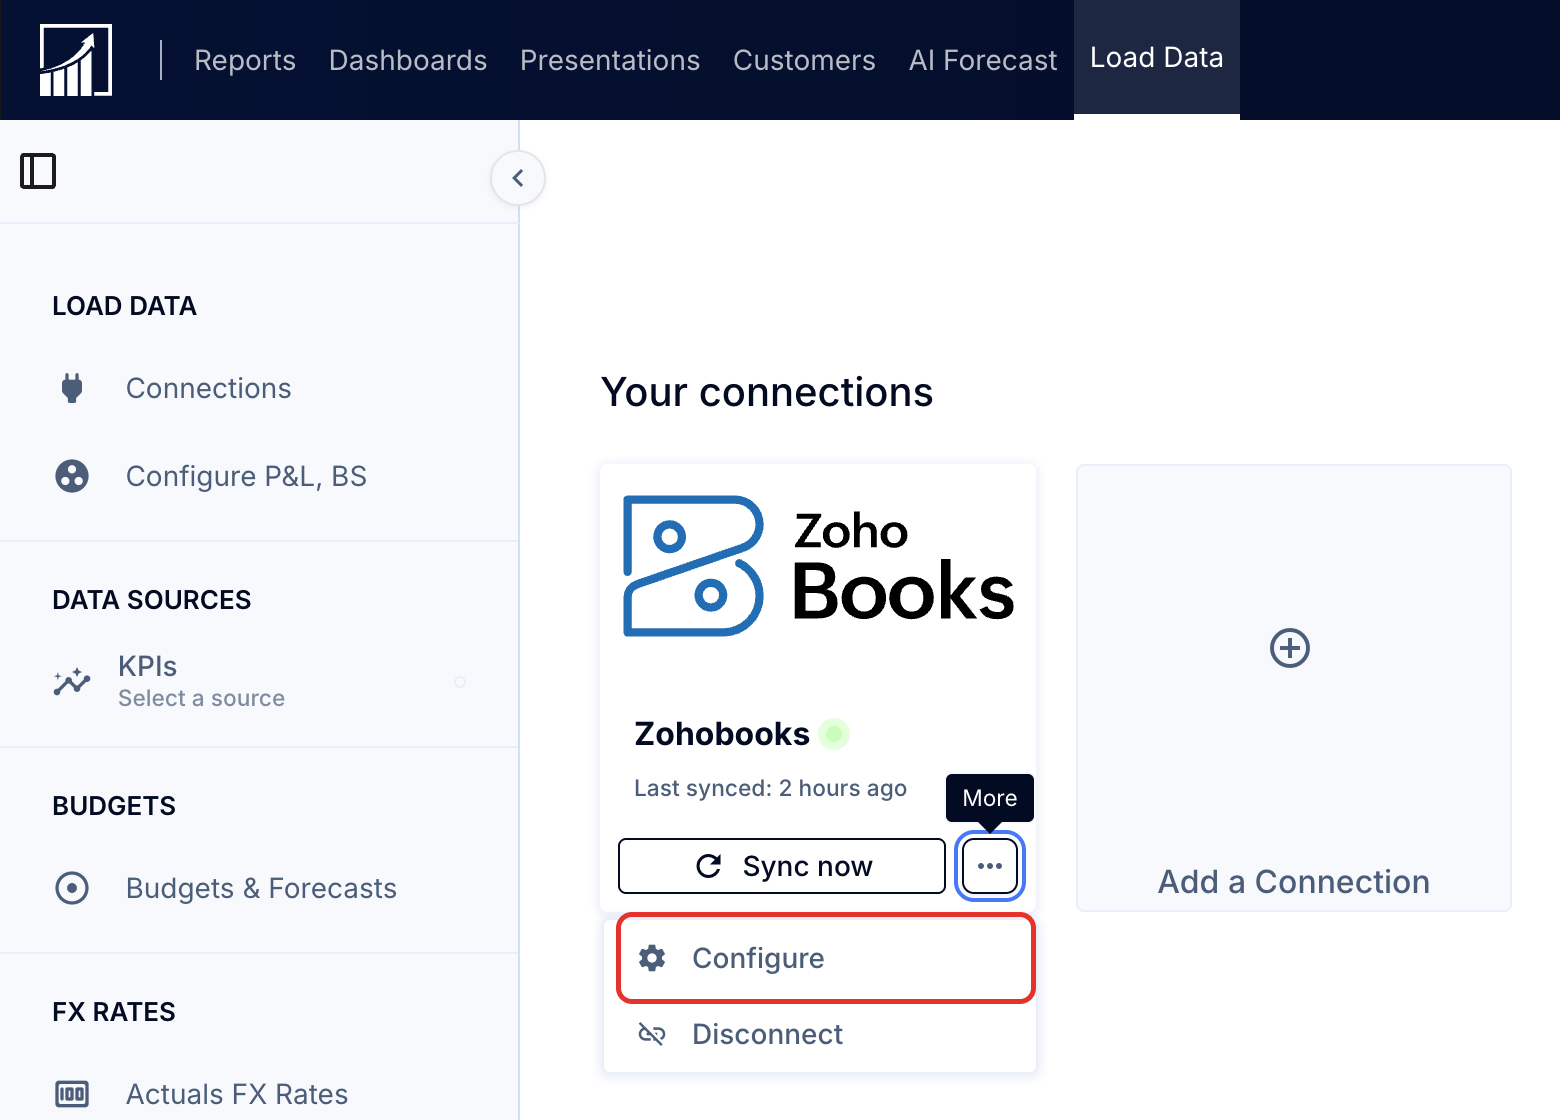
- Go to Load Data (tab at top), then select the three dots, then Configure.
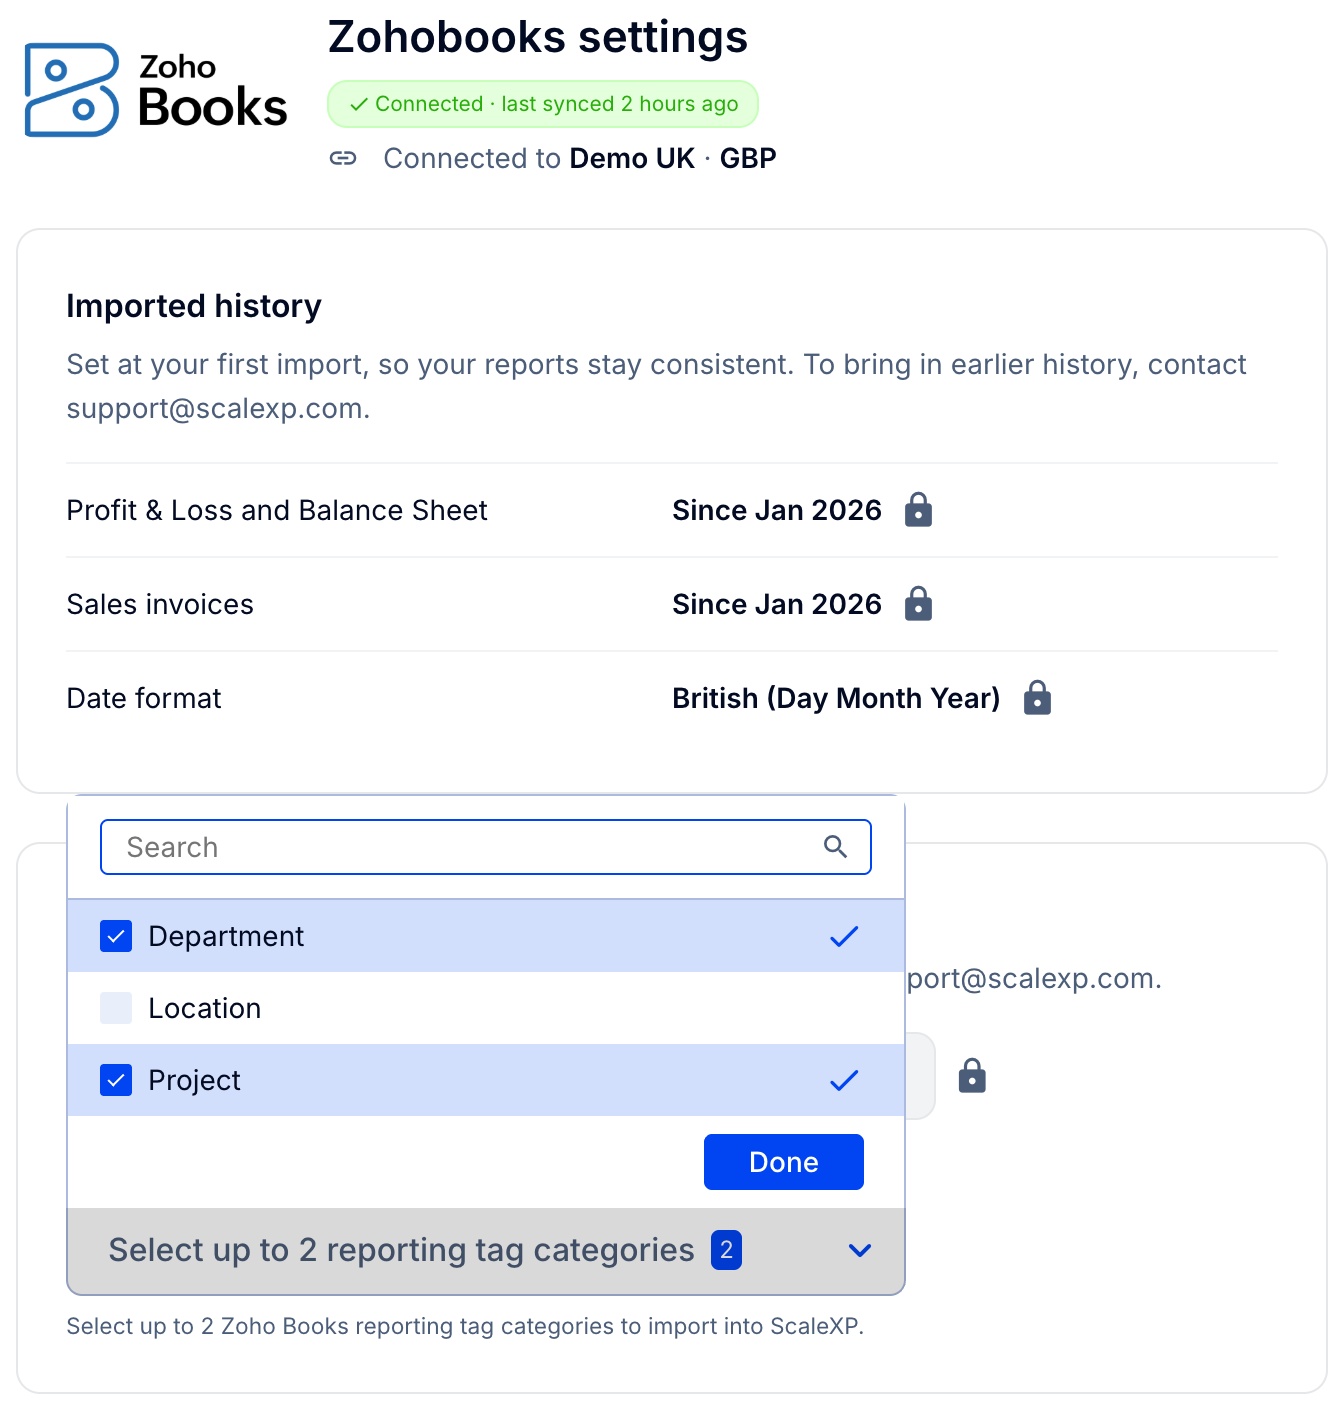
- Under Reporting tags, open Reporting tag categories, select up to 2 categories and click Done.
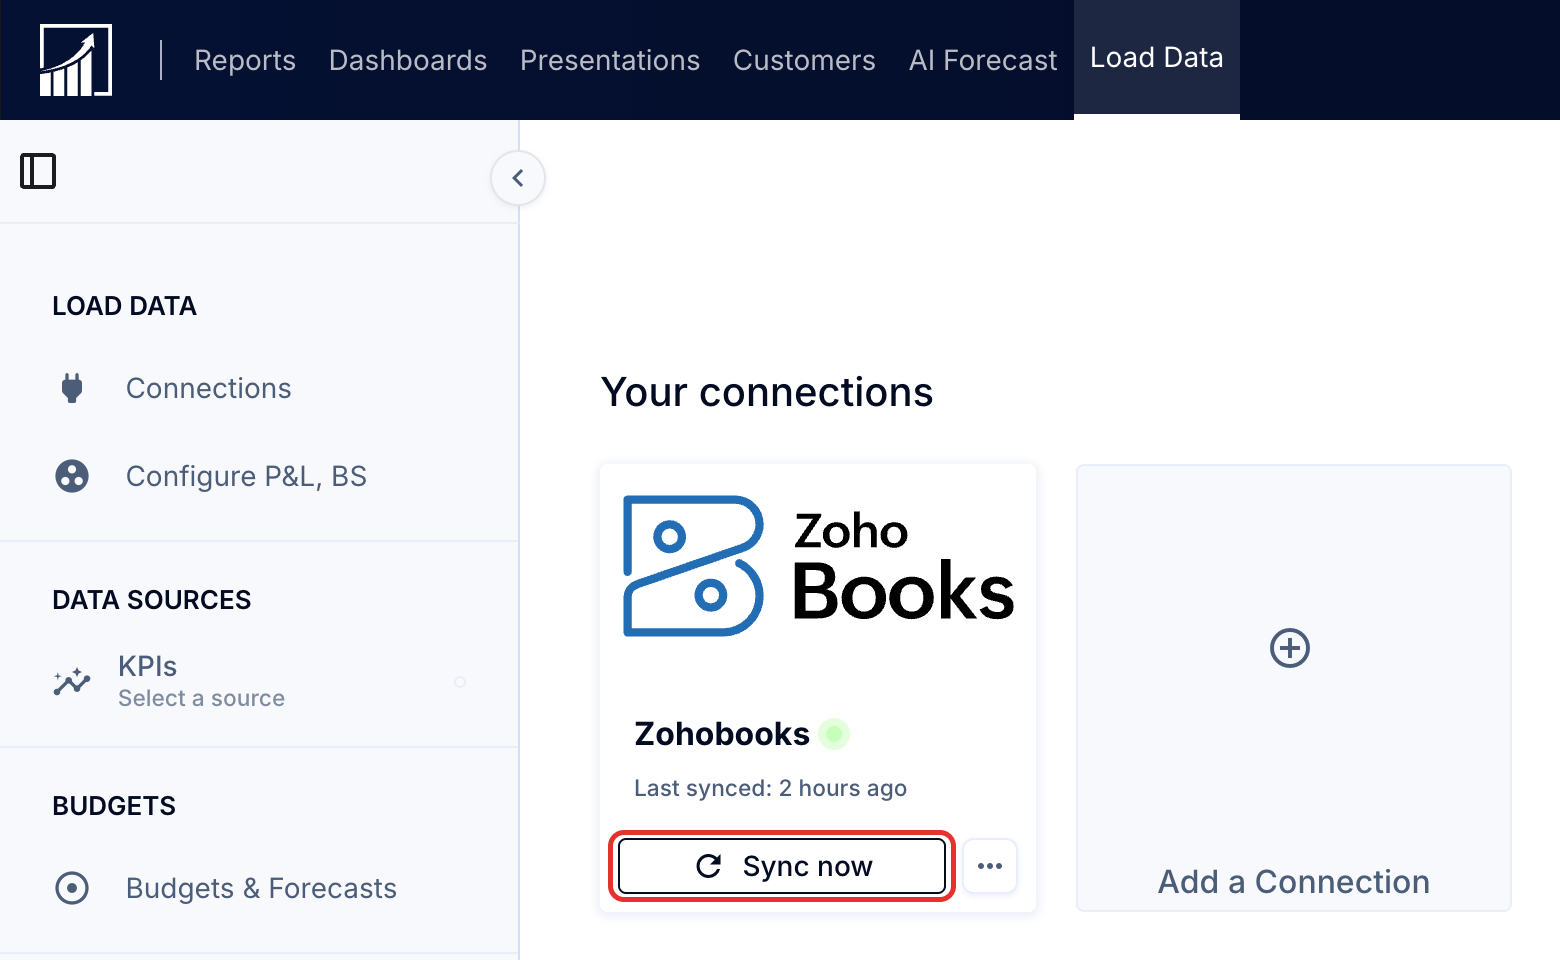
- Return to the main Connections screen and click Sync now.
2. Report using your reporting tags
Once imported, you can report on Zoho reporting tags in any of these ways:
Option 1: Use the new report button to create a report on the reports tab with a column for each option in a tag category
The easiest way to create a new report for Zoho reporting tags is to use the New Reports button. This will enable you to instantly select a code group for which to view all the tags at once, one per column.
- Click New, New report, P&L, Reporting Tags.
- Select the category of tags on which you want to report and click Save.
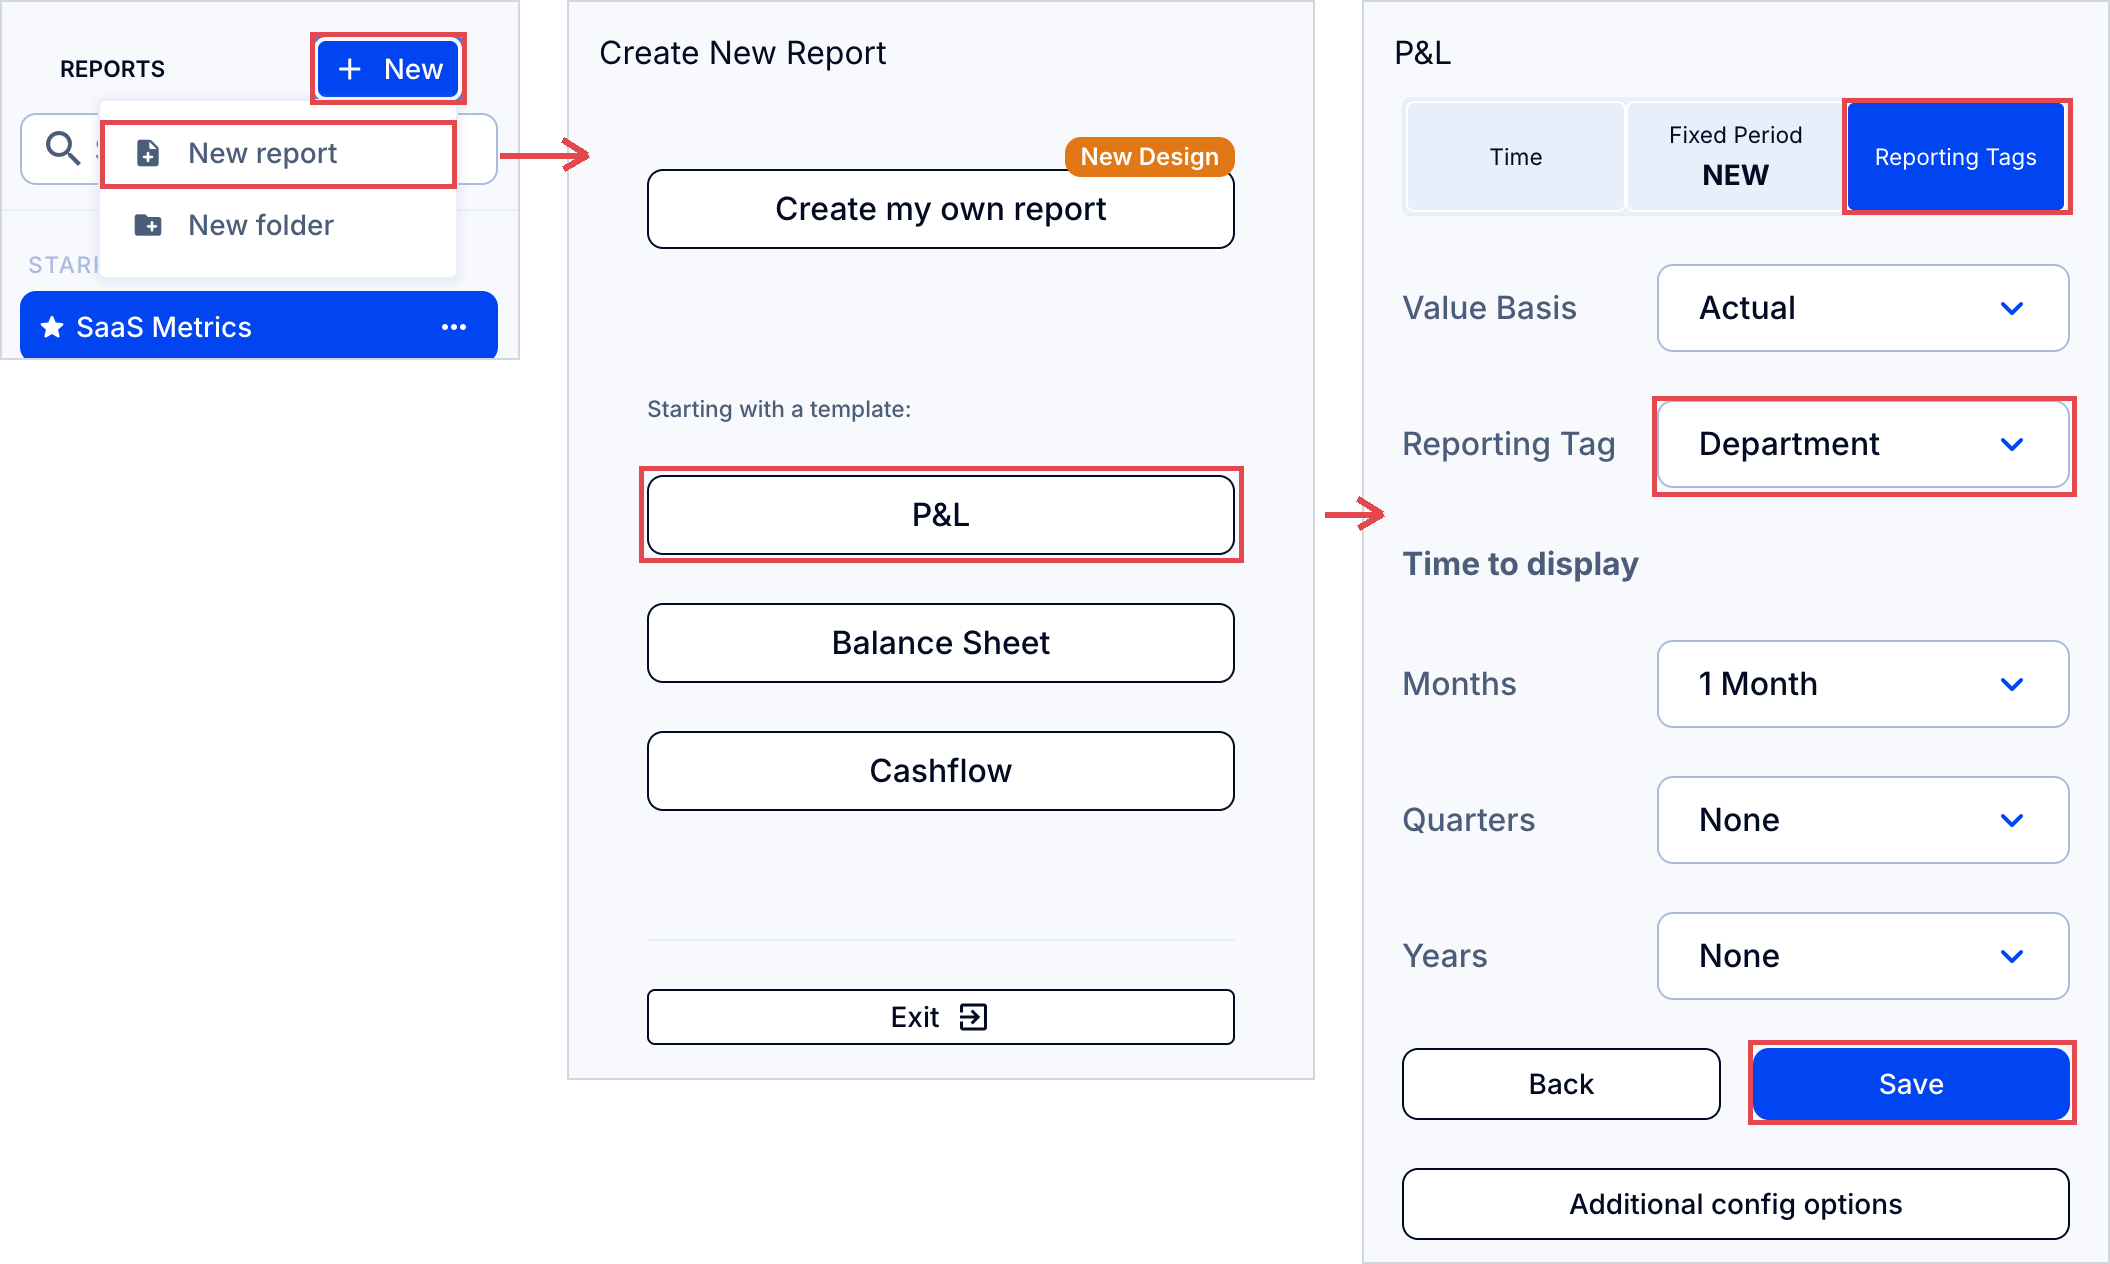
This option will create a new tags report which you can further edit as per the Edit columns option described below.
Important: New reports will not show the tag option for consolidated parent companies or companies without applicable Zoho tags (those having either none or over 90 options per category). See below for further options in these cases.
Option 2: Use the columns configuration on the reports tab
When viewing a report with tags, you can also use Edit columns to select any combination of tags you wish to see, one or more per column. See How to edit a report and create your own custom rows and columns.
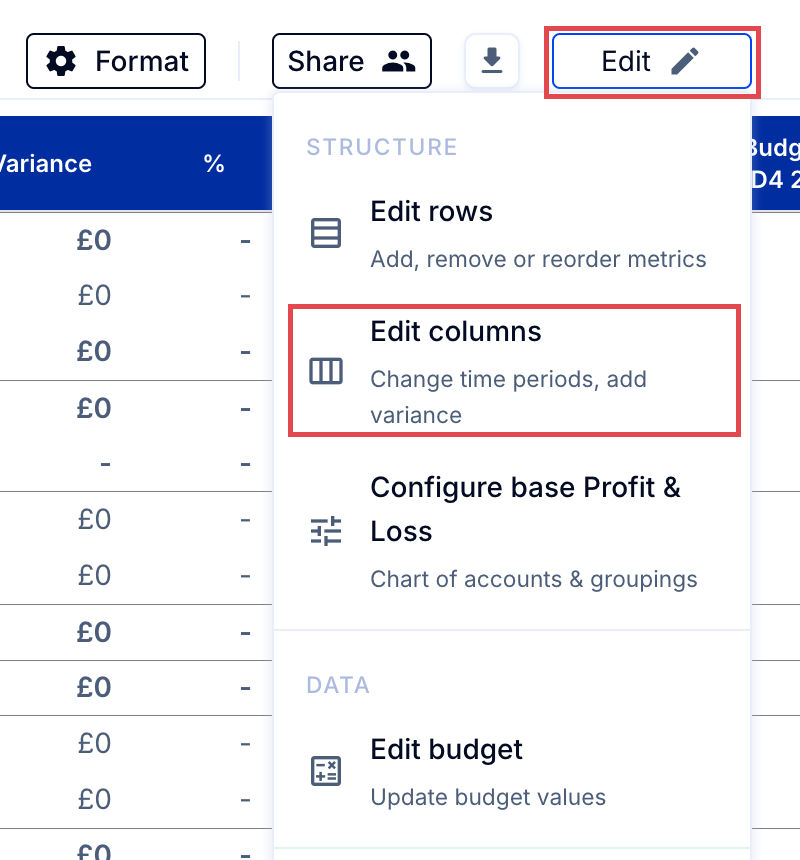
- Click Edit at the top right of the report, then Edit columns.
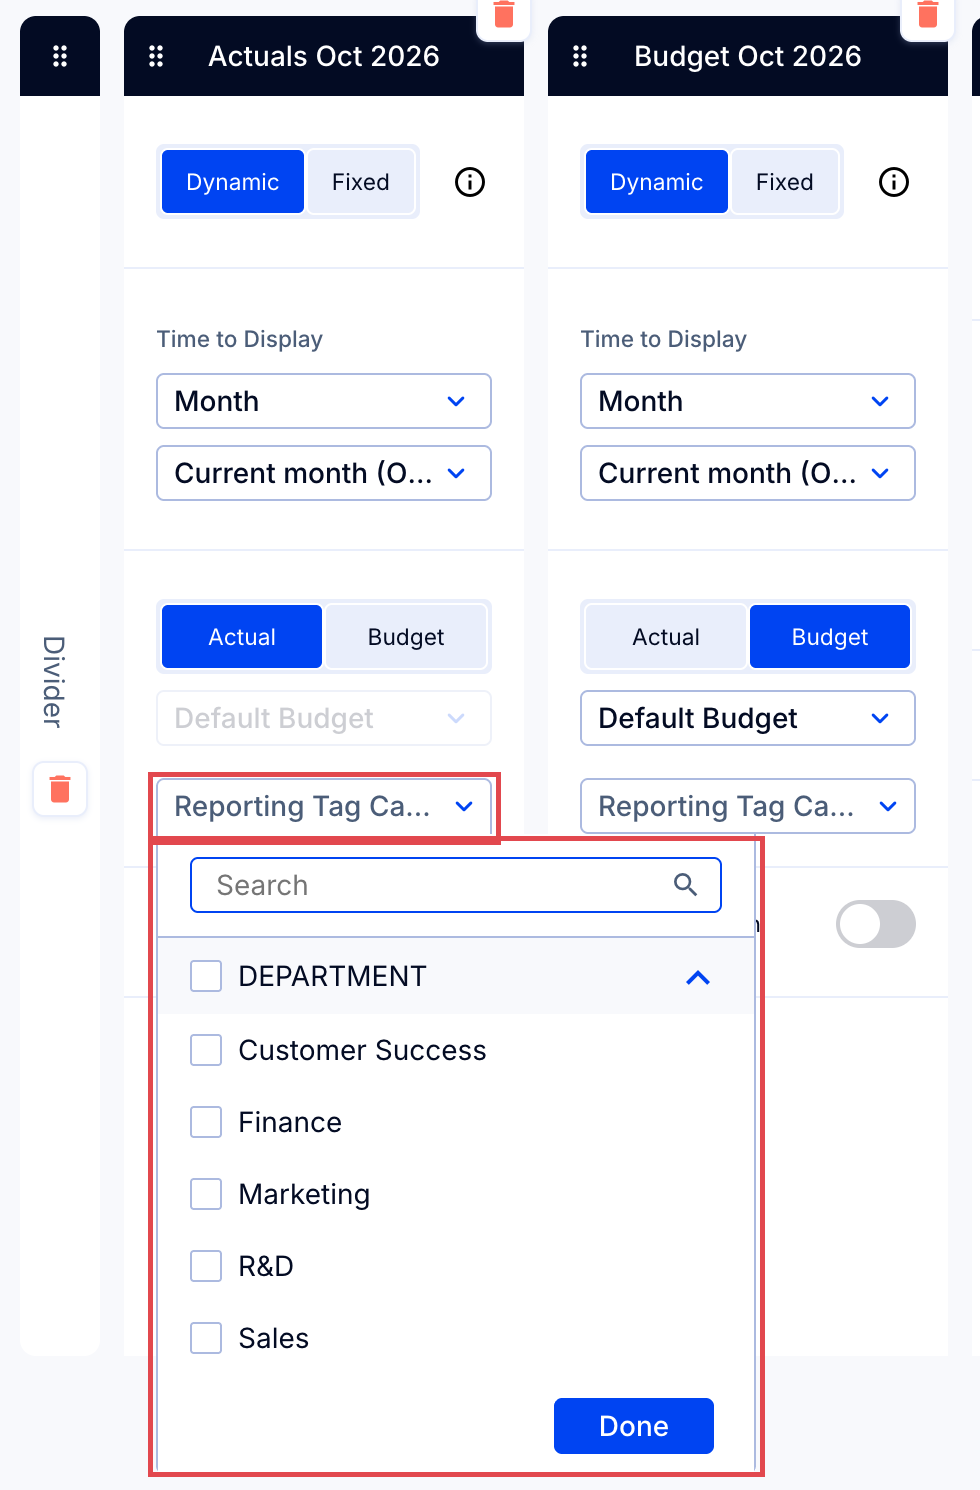
- Select one or more individual tags, Unassigned for unassigned amounts, and/or Reporting Tag Category to get all amounts, regardless of tag status.
- Rename your report to reflect the new tags you have selected and save your new column configuration.
Note: If a Zoho reporting tag category has more than 90 active options, tags reporting is not activated for it. To access this feature, you would need to reduce the number of options to 90 or fewer and then contact [email protected].
Option 3: Use rows editing on the reports tab
In Reports, use rows and formulas with GL accounts to select reporting tags.
See How to add tracking categories, classes or tags as rows in your reports and details below.
When adding a row to a report from the P&L like a financial category, a group or a GL Account, you'll have a secondary option to choose a reporting tag for that row. The same can be done in formulas.
- In any P&L report, click Edit > Edit rows.
- Select Click to Start at the bottom of the rows to add a new row or create a formula.
- Choose an item from the Accounting section like a financial category, P&L group or account.
- Click Done.
- With that row selected, click the cog wheel for additional configuration options.
- Choose one or many reporting tags.
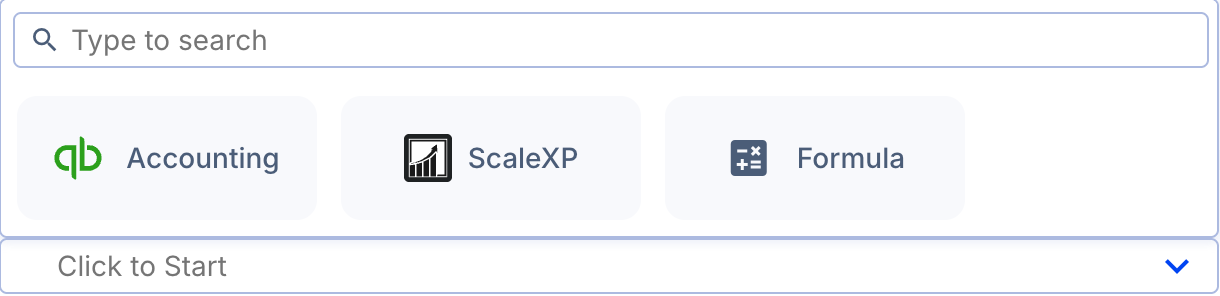

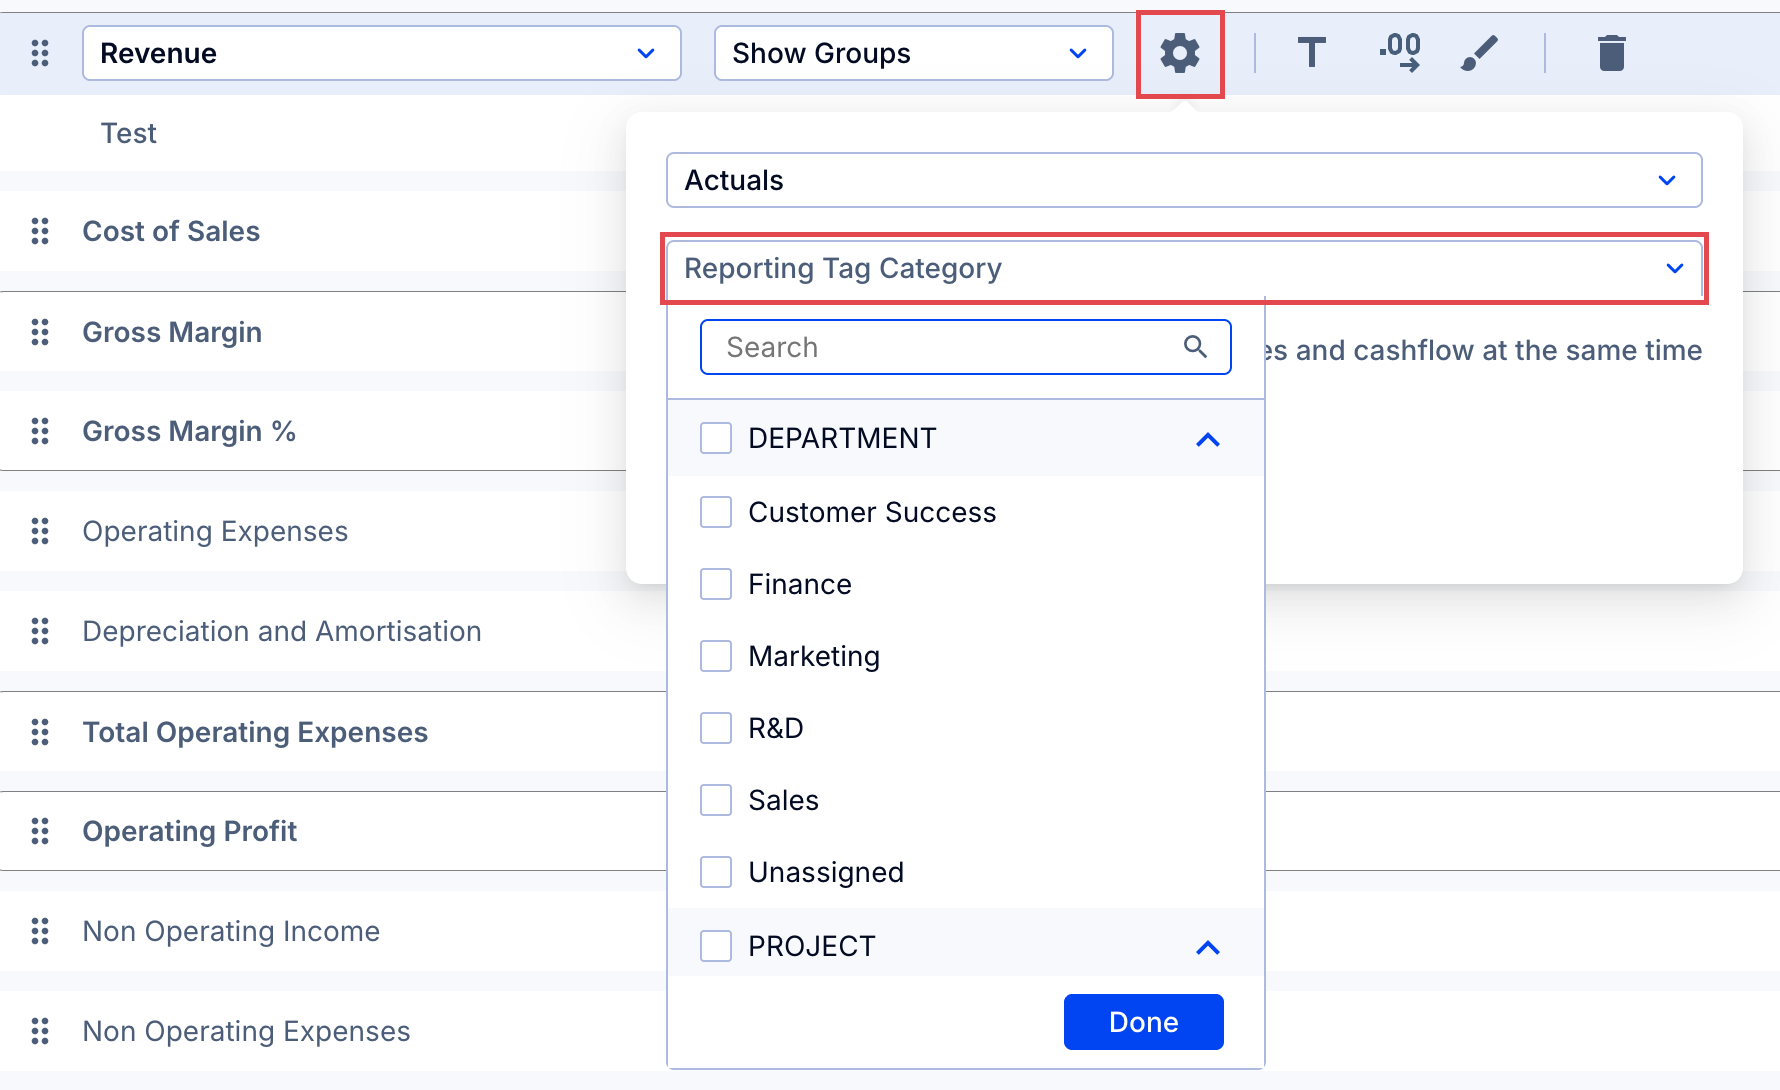
The same steps can be done within a formula. Now this row or formula with tags built in can be referenced by other rows and formulas in the report.
Formulas and metrics are available in reports, dashboards and the Metric Library to select tags as well. Edit any dashboard chart series or metric in the library and follow the same steps as the report above.
Option 4: Use dashboards to create charts and graphs by tag
In Dashboards, use any series or formula with GL accounts to select Zoho reporting tags.
- Use the Reporting Tags option to select which categories to include in a chart or graph.
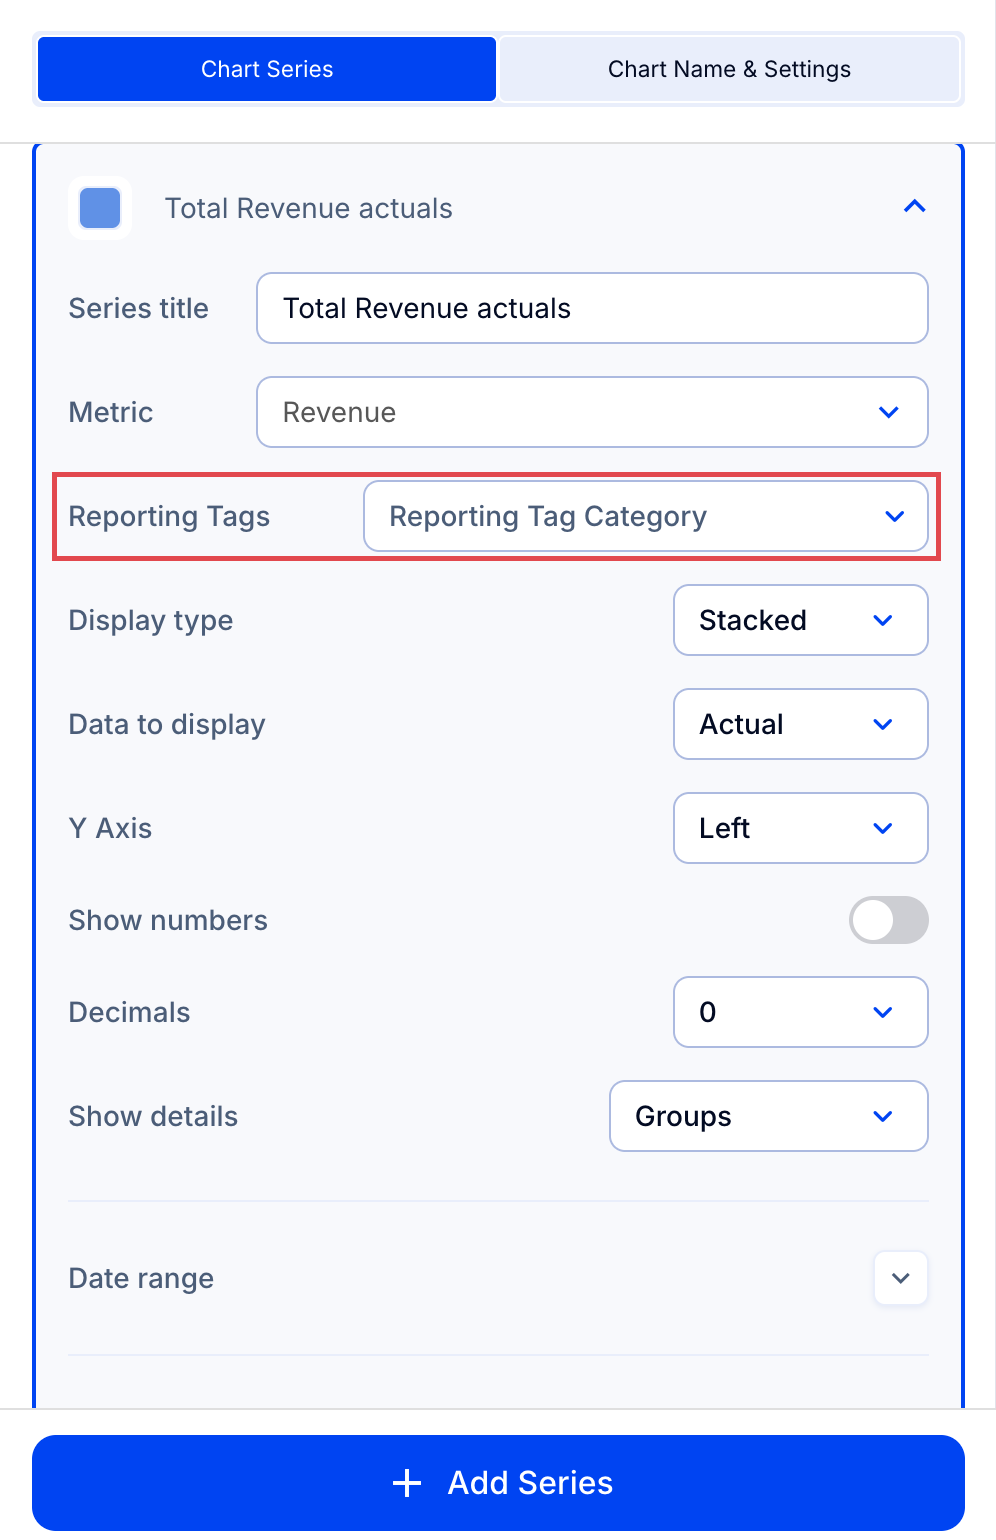
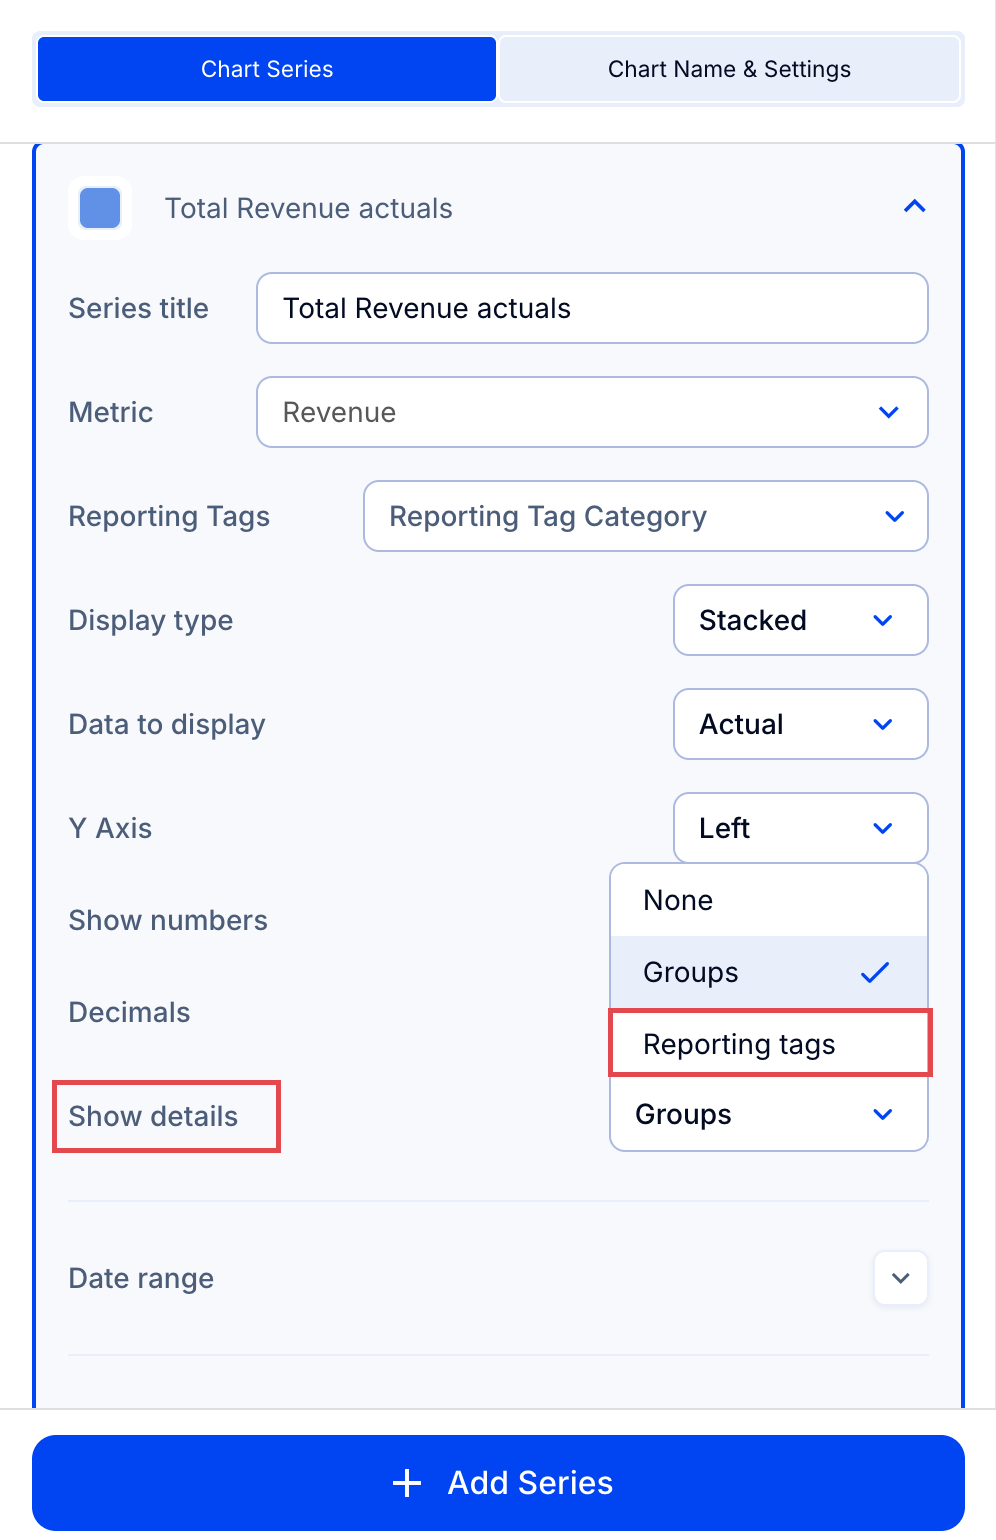
To show a total by tag:
- Create a line for the total.
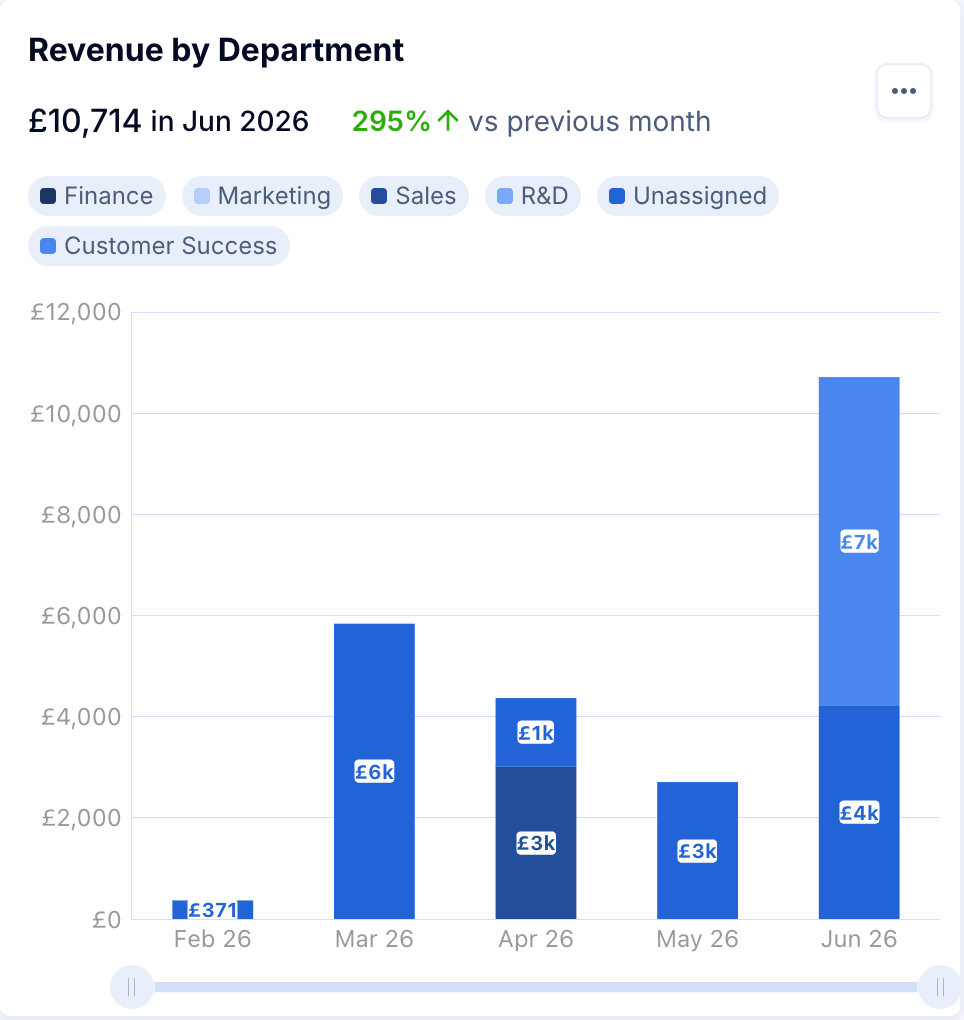
- In Show details, select Reporting tags.
Option 5: Create customer page reports by reporting tag
See How to report on tags for Customer data and Add Metrics from Multiple Customers Pages to one Report or Dashboard.
Option 6: Create custom metrics
In the Metric library, use formulas with GL accounts to select reporting tags. These can be used in Reports and Dashboards.