Customize a report by adding, moving, formatting and deleting rows, and by choosing the columns it shows.
1. Add or change a row
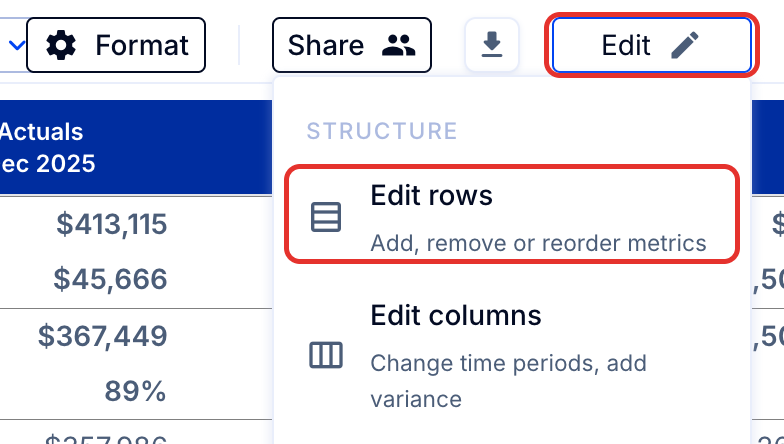
- To change, edit, or add to row content in a report, go to Reports > Edit > Edit rows.
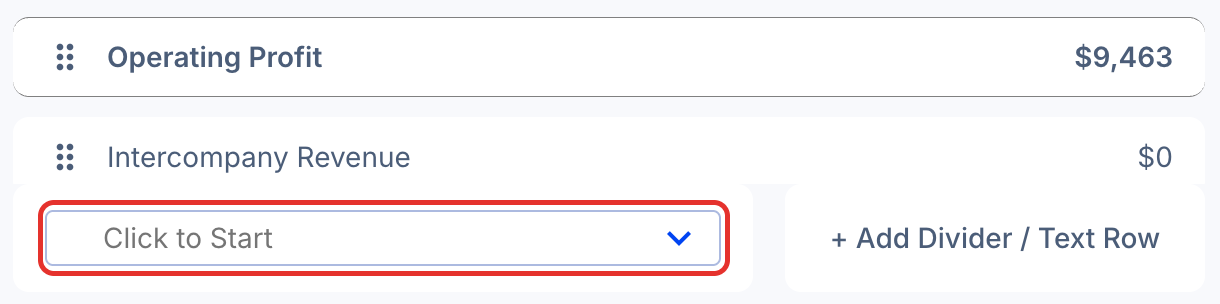
- To add a new row with data in it, click the Click to Start box at the bottom of the editor and select the data and/or formula you wish to add. By selecting Formula, you can create your own combination of accounts, ScaleXP metrics, CRM data, and/or manual calculations. See How to create or edit a formula in a report for help on creating formulas.
- To add a divider row (either blank or with text in it), click + Add Divider / Text Row (bottom right).
2. Move a row
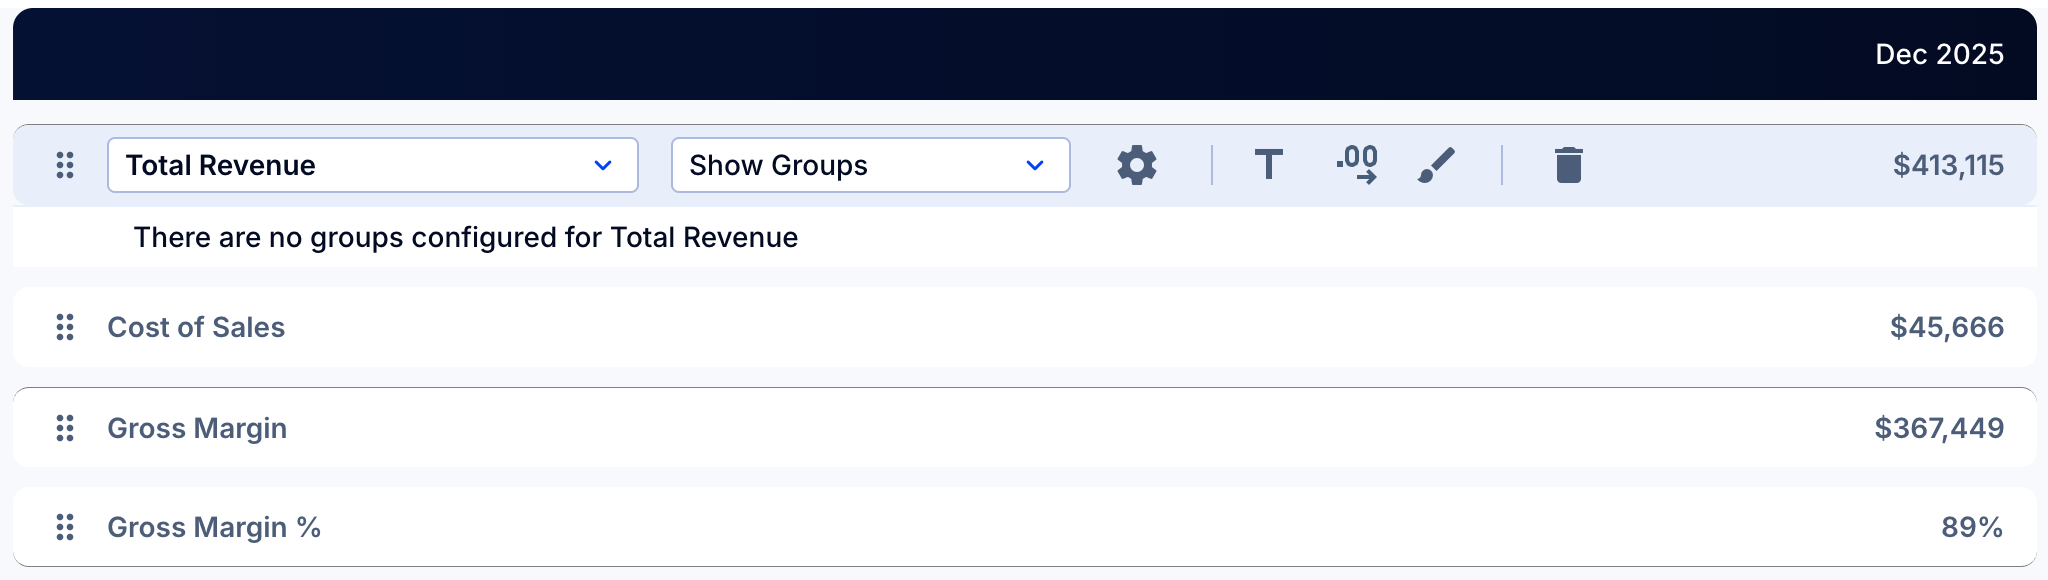
- To move a row, click the six dots at the far left of the row.

To change financial categories, groups, or subgroups (reorder, rename, and/or change included accounts), click Edit (top right of the report) and choose Configure base Profit & Loss or Configure base Balance Sheet.
3. Format a row
- Click on a row to edit it. The row turns blue and reveals its toolbar: the expansion dropdown, then the gear, T, .00, paintbrush, and trash bin icons, as shown below.
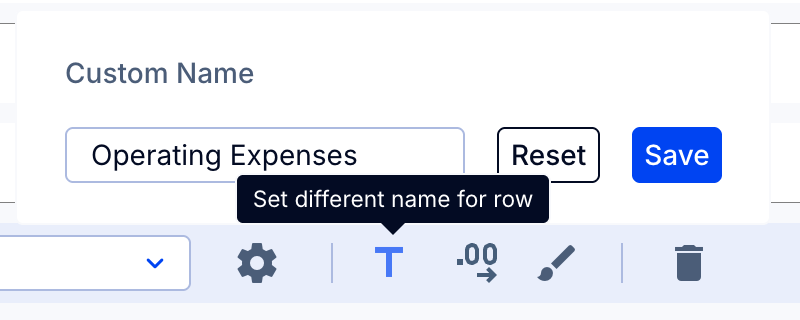
- To rename the row, click the T icon, type the new name into the pop-up box, and save it.
- To delete the row, click the trash bin icon (far right of the toolbar).

- To style the row, click the paintbrush icon to reveal formatting options such as bold/unbold, borders, and color. Use the .00 icon next to it to set the number of decimal places for the row, and the gear icon for additional configuration options.
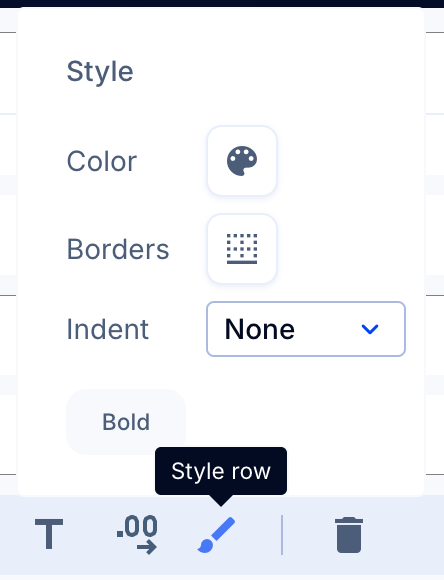
- Decimals: How to format the numbers in a report to show different decimal places or number type
- Color: How to add color to a report
- Borders: How to add a border to a report
- Click Bold to bold/unbold the text.
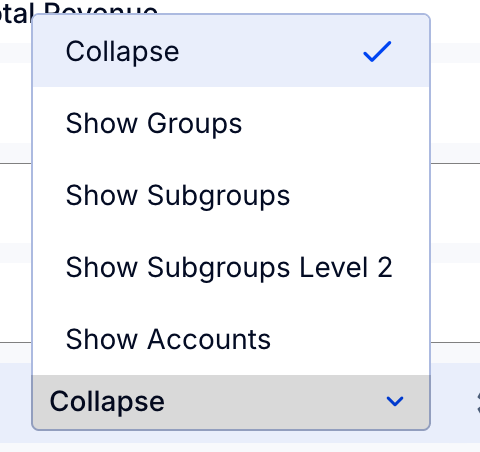
- To choose the level of expansion detail for the row (so detail shows by default without expanding in reports, and shows when used in presentations), use the expansion dropdown menu. See How to expand/hide rows in a report.
Tip: To hide (or show) rows with nil values on all reports, go to Settings > Organization settings > Organization values and change the toggle under Hide accounts with 0 values.
4. Edit columns (time periods, budgets, variances, and more)
- Open the columns from the main reports page or from within the report editor.
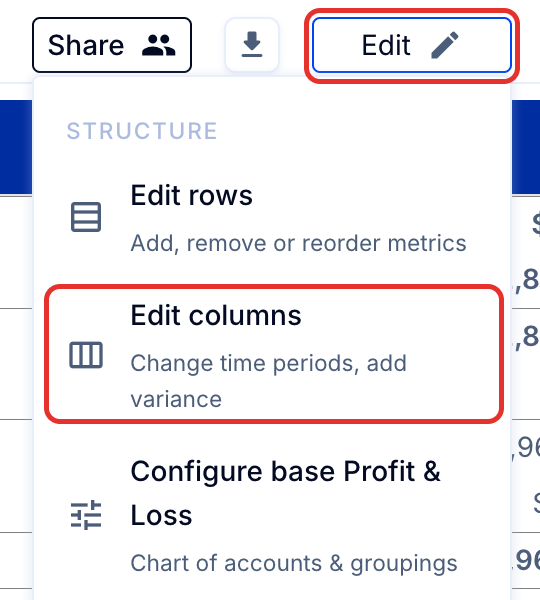

- Choose from pre-selected columns or create your own combination.
Columns can cover:
- time periods like month, quarter, year, year to date, etc.
- tracking codes, classes, or accounting entities - either individually or in combination
- budgets of your choice
- variances between columns
Read more in How to create and edit report columns.
Other helpful hints
Click Edit, then Configure base Profit & Loss or Configure base Balance Sheet, to change the way accounts are categorized and create new groups. See How to configure your P&L and balance sheet in ScaleXP (consolidated company) or How to configure your P&L and balance sheet in ScaleXP (single company).
To change the definition of a metric for use across reports, KPIs, charts, graphs, and presentations, go to Settings > Metric library and find the definition you wish to change. See What is the ScaleXP metric library?
To check the figures in a finished report, select any account row to see the transactions behind the balance for that column's period. See How to see transaction detail behind account balances.
To export every transaction behind a P&L report for a month, quarter, year to date, or full year in one file, click the download icon (top right, next to Share) and choose Download Transaction Detail. See How to download a report to Excel.